Logo der Fa. Techmeter


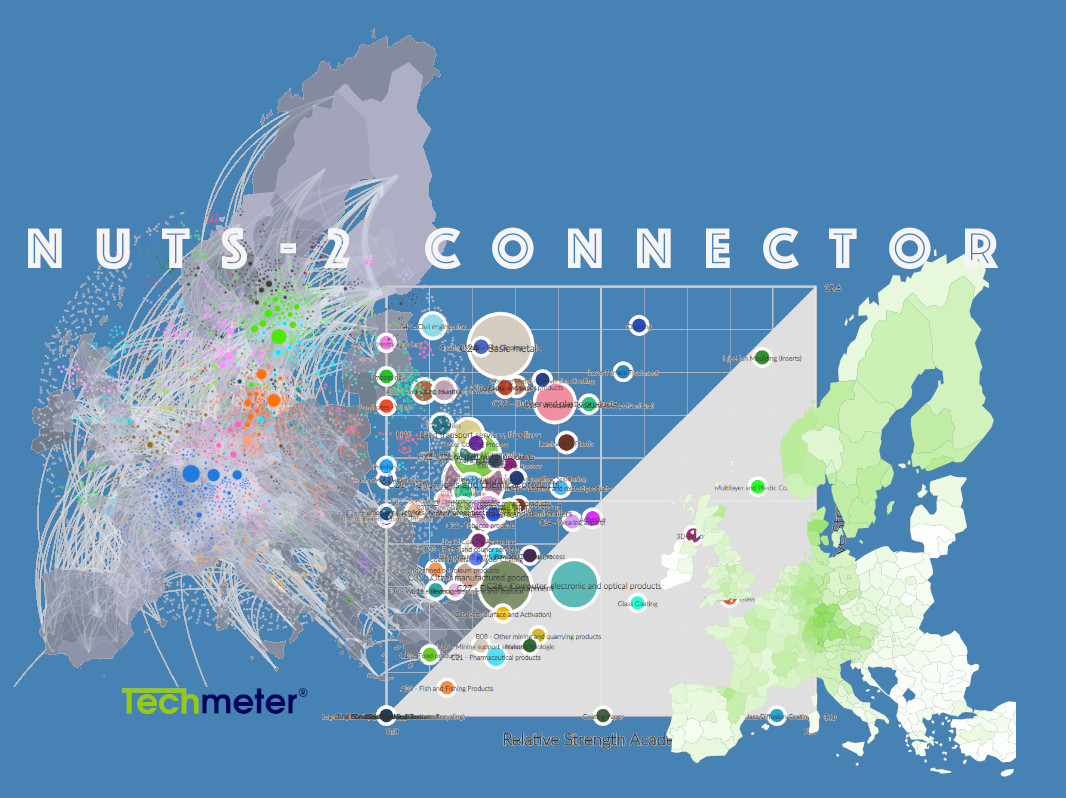
NUTS-2 CONNECTOR

Our TechMeter NUTS-2 CONNECTOR supports decision makers in NUTS-2 regions and contributes to a connected Europe without limits.


Based on regio-specific technology networks for each NUTS-2 region in Europe the specific strengths, weaknesses and dual-strengths are detected. From this information, relevant measures and policies are derived, such as finding of new cooperation partners, regions with specific technology profiles, research institutions, production sites or startups in relevant technologies. Thereby, individual regions are strengthened and build a robust base for a Europe without limits.


Green Technology Analyzer

The interactive Green Tech Analyzer provides low-threshold access to inspirations 💡 and innovative solutions, enabled by significant key technologies.

The Green Tech Analyzer offers an overview of global dynamics and competitive landscapes. Furthermore, the overview can be broken down to details about emerging technologies and even further to specific innovations and research reports.


Technological innovations are a key piece in the puzzle of managing the climate crisis.

„The best time to plant a tree 🌳 was twenty years ago. The next best time is now”
(African proverb)
a woman jogging through the wood a poster with the slogan fridays for future sun flower and bee wood of birch treesgirl walking in the wood a butterfly an off-shore windpark oasis in the desert

Key enabling technologies
for
… renewable energy …
… material efficiency …
… energy efficiency …
… logistics …
… automation …
… mobility …
… biotechnology …

Every week our algorithms detect new solution patterns from millions of scientific documents.

The Techmeter
Green Tech Analyzer

maps tomorrows pieces of the puzzle.

The potentials of key enabling technologies for specific application areas are outlined transparently and with all different levels of detail and granularity.

weeks until 2030


Techmeter Regional Analyzer

Our Techmeter Regional Analyzers support regional development agencies.


Techmeter Regional Analyzers deliver live-dashboards with key metrics needed to develop high-impact action plans and to track the success of Smart Specialization initiatives.

Smart Specialization Strategies are key to foster Europe's innovation strength. They are characterized by its regional technology focus and they are conducted in a closed-loop process of (i) regional performance analysis (status quo and success tracking of implemented measures), (ii) assessment of peer-regions (global benchmark), (iii) SWOT analysis and action plan and (iv) implementation.

Live-dashboards of the Techmeter Regional Analyzers support the first three process steps with easy-to-interpret, robust and current information.


CORPORATE SUPPORT

TECHMETER INNOVATION PORTALS


Techmeter's innovation portals provide insights into previously hidden information, outlooks on trends and overviews of networks.

What is so special about a Techmeter Innovation Portal?

Our Techmeter Innovation Portals (technology and data portals for technology, business and society), Techmeter Regional Analyzers and Techmeter Green Technology Analyzers are browser-based software solutions. What is special about them is that we developed a complex algorithm with which we can identify, analyse and evaluate emerging technologies, using all global patent data. Emerging technologies are a central key to innovation. This outlook on trends provides an information advantage. A retrospective view of dynamics provides the basis for predictions. Valuable and often surprising information is revealed during the identification, analysis and evaluation process. This is why our Techmeter innovation portals are used in various fields.

Who benefits from using a Techmeter Innovation Portal?

For R&D DEPARTMENTS, they accelerate the established innovation processes and offer creative solutions and special detailed information.

They support COMPANIES WITHOUT SPECIAL R&D DEPARTMENTS, because they offer easy access to information about innovative technologies, materials, suppliers and research partners.

They enable EMPLOYEES to quickly check themselves whether their ideas are patentable without going through mountains of paper records, because they provide structured, electronic patent data.

They help MARKETING SPECIALISTS to evaluate the market potential and analyse the competitive environment.

They support STRATEGY EXPERTS in recognising emerging key technologies early.

MANAGEMENT AND EXECUTIVES benefit because innovation takes place in a logical, objective and data-driven way with an information advantage of 200 weeks for technology development, independent of personnel resources and personal preferences.

ECONOMIC RESEARCH, LOCATION RESEARCH, MARKET RESEARCH etc. receive additional input because of the new research methods of the Techmeter big data patent analysis. Connections immediately become visible.

How does a Techmeter Innovation Portal work?

The search term is entered in the search field, the Techmeter Innovation Portal structures the corresponding raw data and makes it manageable in a sortable list. The results are also visualised using graphics which can be interpreted immediately. Several modules are available to this end, providing the most exact anwsers depending on the question.

Which topics are suitable for the use of a Techmeter Innovation Portal?

Almost all topics around technologies are suitable for research using patent analysis by our Techmeter innovation portals. During our consultancy projects, there is a briefing before the project starts, where we conduct a feasibility study, amongst other things. Our Techmeter innovation portals provide perspectives for seminal questions such as:

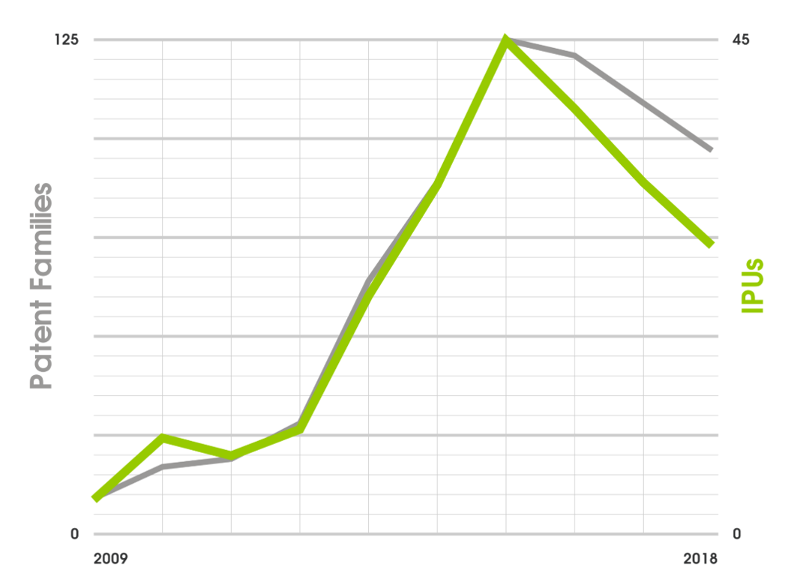
Graphik showing life cycle

Is a certain technology still growing or has growth stagnated?

Is it worth investing in a certain technology?

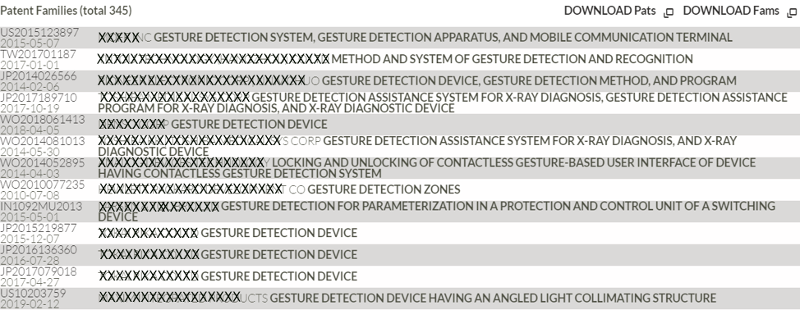
List of documents

Which technologies are growing exponentially?

Techmeter logo
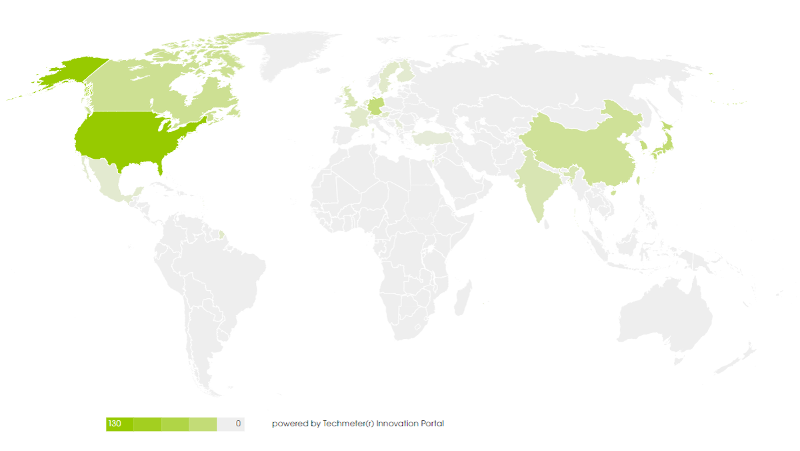
Graphic showing a map

Where do competitors hold patent rights and what is their geostrategy?

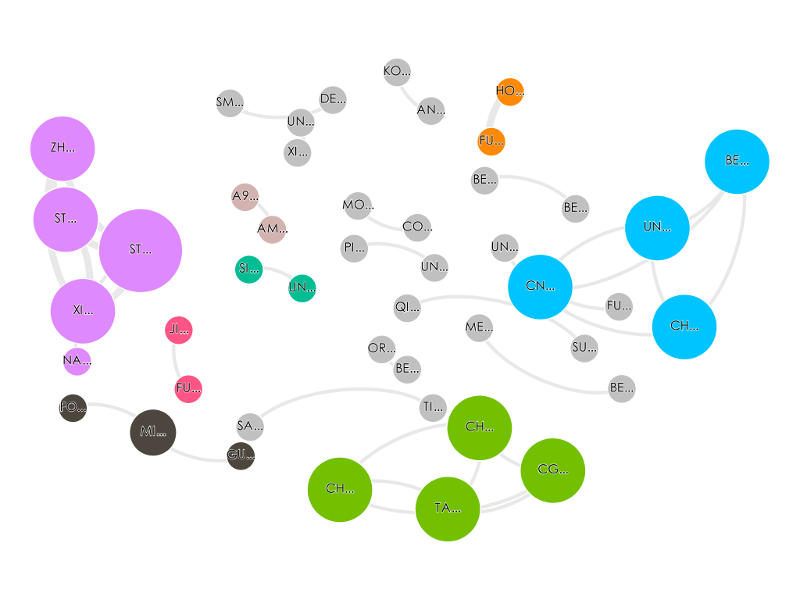
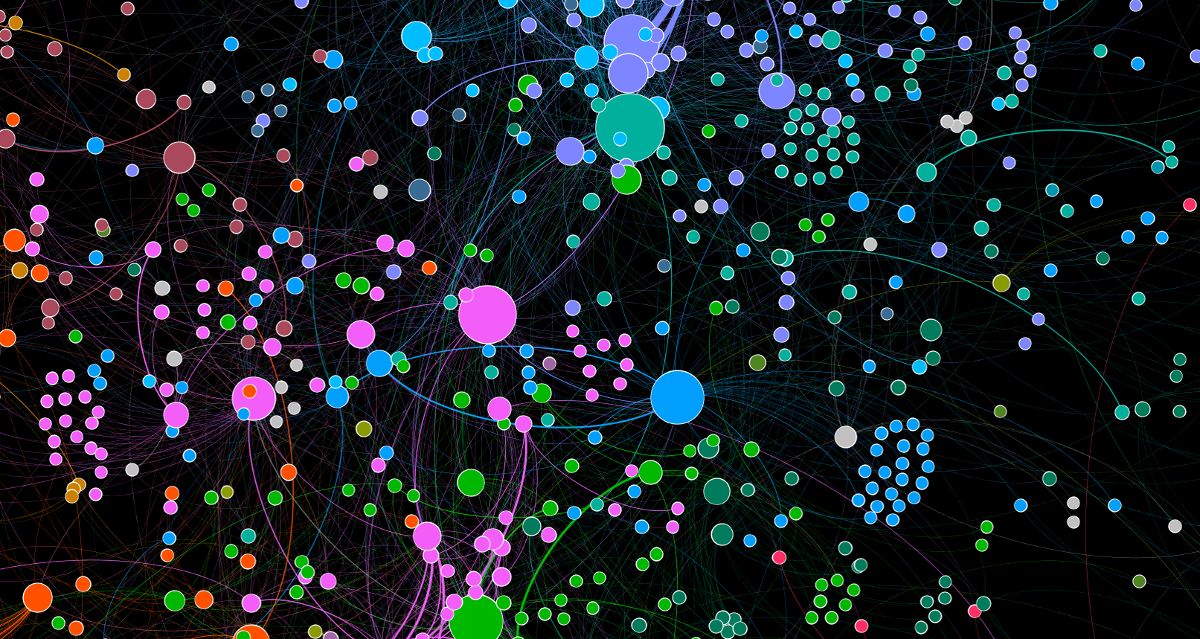
Graphic showing a cooperation network

Which technologies are emphasised in which regions?

Which companies or universities influence a certain technology the most and how do they cooperate?

Graphic showing a patent data network

How are certain technologies connected?

Graphic showing a technology network
Graphic showing big data

What are the central technologies?

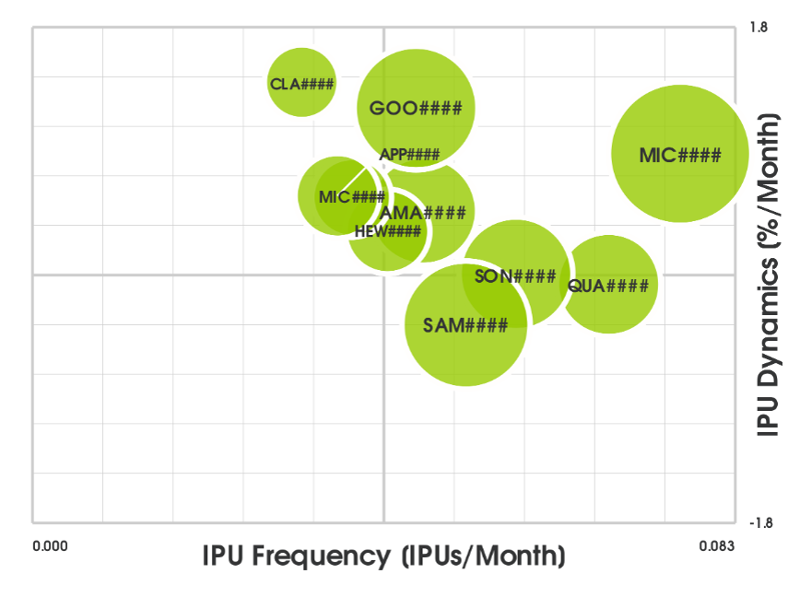
Which are the leading companies in terms of technology?

Graphic showing portfolio
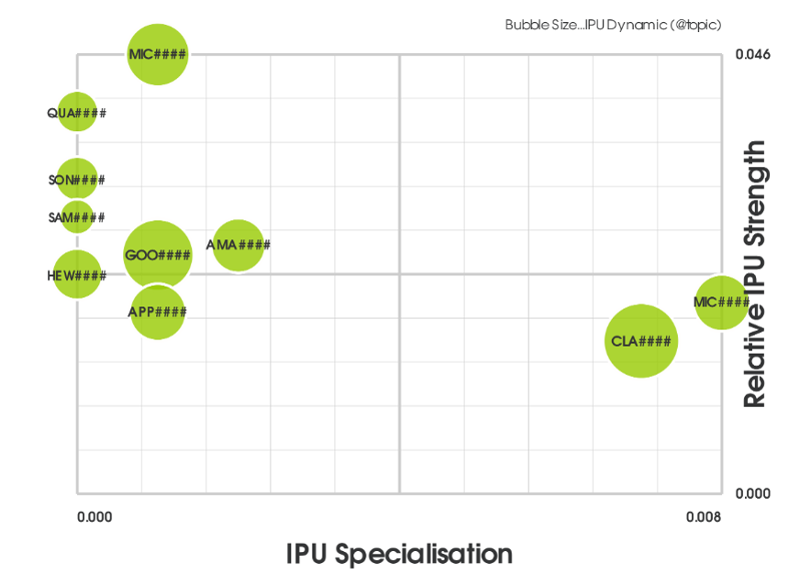
Graphic showing company portfolio

Which companies have specialised the most?

Graphic showing emerging technologies

Which technologies are used?

Which technologies and ideas are trending?

Graphic showing tags


Your first step towards an analysis using a Techmeter Innovation Portal

You can let us create your analysis.
We elaborate specific questions with you, interpret and evaluate the results for you and create an extensive report. During a consultancy project, you can use a Techmeter Innovation Portal. This way, you can also retrace all steps of the analysis yourself. You can also further examine detailed information about the results flexibly and at any time, depending on your own search criteria.
We also offer another option:
You can lease a Techmeter Innovation Portal and create your own analysis. Our innovation Portals are configured individually, depending on your needs, using the modules relevant to you. The software is easy to use and intuitive, and we will provide training and support. We can also consult 1 to 3 key users during a certain period of time.